
I wrote about playing with the full OpenAlex dataset via SQL in a recent post. One of the outcomes of that experiment was this quick look at the relationship between researcher impact and who researchers publish with.
Introduction
Bibliometrics researchers try to answer a variety of questions about the participants, tools, processes, and reach of the research enterprise by examining the ways in which they are communicated: through scholarly publishing and its associated activities. Often, these questions focus on the impacts of research and researchers, and the factors that influence them. The answers to these questions can influence academic policies, funding decisions, tenure tracks, and the course of research as a whole.
Unfortunately, impact is difficult to define. Much ink has been spilled extolling the virtues and shortcomings of various definitions without reaching a consensus. To partially circumvent this difficulty, various measures have been proposed that aim to approximate or describe elements of impact, while still being possible to measure. These too have been the focus of significant heated debated, both for their practicality as measurements and their merit as proxies for research impact.
Collaboration is another area of active investigation within the field of bibliometrics, and is also difficult to define. Topics such as author order for journal articles, inter-institutional and international research teams, and hyperauthorship continue to receive attention in the academic discourse. Benefits and challenges of authorship collaboration are explored for the purposes of maximizing scientific progress as well as optimizing career trajectory for researchers.
Within that context, this paper aims to explore a simple question: does high research collaboration correlate with having an increased impact as a researcher? Since both of those are difficult to measure, I will utilize two stand-in indicators in their place. For collaboration, I will count the number of authors that an author shares a journal article authorship with, as well as the number of works where they have collaborated. For impact, I will use the h-index, a measure that combines the number of papers an author has published with the number of citations those papers have received, under the assumption that citation represents some impact on the research discourse.
Data
To answer this question, an examination of authorship and citation of works had to be undertaken. OpenAlex, an open dataset that includes high quality authorship and citation information, was an ideal candidate for the source of the necessary data for the analysis. The full dataset at time of retrieval included records for 479,290,642 distinct works and 107,541,376 distinct authors. Because citations for a paper can happen years after the paper itself is published, it was necessarily to limit the end-year of consideration to ensure adequate time for citation generation had elapsed. I chose to limit consideration to works published no later than 2009. Since bibliometric data become less standardized and available in digital databases the further back in time one goes, a similar limit of no earlier than 1990 was also established. To reduce the possibility of confounding variables, I further limited the works to journal articles, written in English, and which had not been retracted. Each article in the dataset contains one or more links to authors, but our inquiry is related to collaboration, so we could further remove any articles that had only a single author. The citation count of each work was collected, but the publication date of the citing paper was not considered. The OpenAlex dataset contains fields for all of these variables, and as a result of the filtering, 51,403,287 articles and 13,614,439 authors were included for initial consideration.
Methods
Researcher impact
Researcher impact was then calculated using a standard h-index, as follows:
- For each author, collect all papers on which they are an author.
- For each paper, collect the number of papers that cite it.
- Order the list of papers for the author by the number of citations each has, from most to least.
- For each paper in the ordered list, compare the number of citations to its place in the list (if this step were a paper on the list, it’s place on the list would be 4).
- For the last paper for which the number of citations is greater than or equal to its place on the list, its place on the list is the author’s h-index.
Authors who have published many papers but received low citations will have a low h-index, and authors with very high citation counts but few papers will also have a low h-index. Authors with high h-index values are those who have published many papers that have all received many citations, indicating both a broad and deep contribution to their field of research.
The h-index was chosen for this investigation because the data needed were available in the dataset, and because the calculation process to arrive at the number is straightforward. The h-index is theoretically unbounded, ranging from one to infinity. In practice, the highest h-index identified in this analysis was 314.
Collaboration
Two collaboration scores were calculated as part of this analysis. The first was to count the number of distinct authors each author shared authorship of a paper with. This was accomplished as follows:
- For each author, collect all of the papers on which they are an author.
- For each paper, find all of the authors that are not the author from step 1.
- Take all of the authors identified in step 2, and remove duplicates. This is the number of distinct authors, and is the first collaboration score.
The second was to count the total number of collaborator-works. This process is similar to the above, but without removing duplicates:
- For each author, collect all of the papers on which they are an author.
- For each paper, find all of the authors that are not the author from step 1.
- Take all of the authors identified in step 2. This is the number of collaborator-works, and is the second collaboration score.
Thus, if author A and author B had written four papers together, each would have an individual collaborator score of 1 and a collaborator-works score of 4. The second collaboration score is always greater than or equal to the first collaboration score. Both of these scores are unbounded the same way that the h-index is, with the highest scores in the examined data being 23,152 and 383,994 respectively.
Correlation
The h-index and the two collaboration scores together constitute three variables. The research question is whether the h-index is correlated with the other two scores, and if so, how strongly. To determine that, the data were analyzed using a standard Pearson correlation coefficient to examine the relationship between the measurements. This test was used because it is appropriate for two numeric variables without assuming the data follow a particular distribution. The correlation value will show how strongly the two variables correlate, but cannot be used to identify causation. A p-value threshold of 0.05 was used to determine whether the correlation between the measurements was statistically significant rather than a result of random chance.
Results
The Pearson correlation coefficient is a normalized indicator of how strongly one variable’s value correlates with another’s. A value of 1 indicates perfect positive correlation, as you might see if you compared Fahrenheit and Celsius temperatures. A value of -1 indicates perfect negative correlation, as you might see if you compared the number of steps descended down a staircase with your height above the ground. A value of 0 indicates that the values are not correlated at all, and are completely independent. Since we are sampling real world data, a perfect correlation is unlikely, but some correlation is likely to exist. However, it is also possible that the data truly is unrelated and random, and random points can sometimes form a line; doing so is improbable, but not impossible. The p-value threshold of 0.05 is used to provide a 95% confidence rating that the correlation coefficient represents correlation that truly is present, rather than a result of random chance.
H-index and distinct collaborators
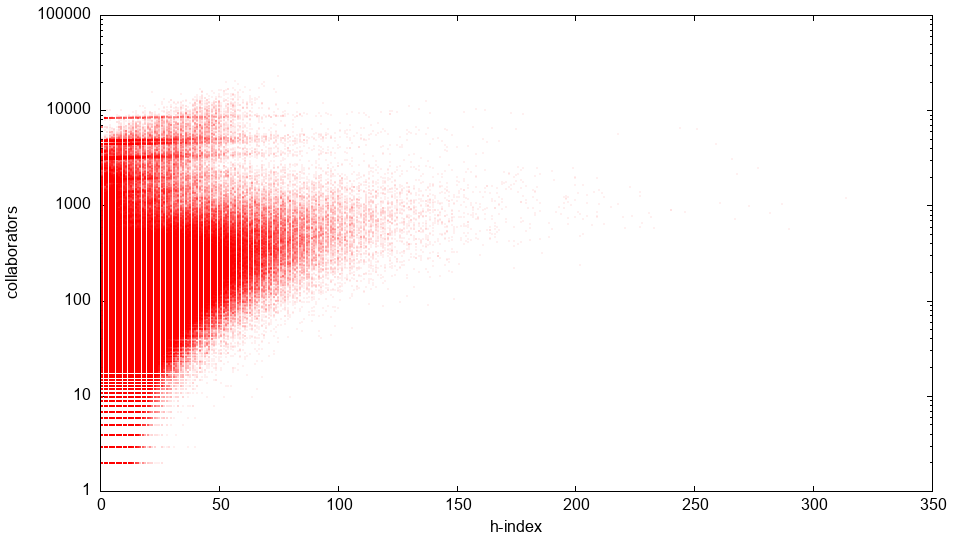
The Pearson correlation coefficient was calculated for the h-index and distinct collaborators score to determine if there was a correlation between the author’s research impact and the number of researchers they authored papers with. The result was a correlation coefficient of 0.27. This value indicates a positive correlation between the variables, that is to say, a higher h-index is correlated with a higher number of distinct collaborators. However, the value is closer to 0 than it is to either 1 or -1, implying that the correlation is not very strong. This means there is some relationship between these two measurements, but there are likely to be other factors that influence each. The p-value here was extremely close to zero (0.000…(insert 284 zeros here)…000196), which means we can be highly confident that this coefficient result is not a result of random chance. Given that the number of data points is 13,614,439, it’s extremely unlikely that this many random values could produce a line with a coefficient as high as 0.27. In graphical form, the data for these two variables look like this (logarithmic scale):
H-index and collaborator-works
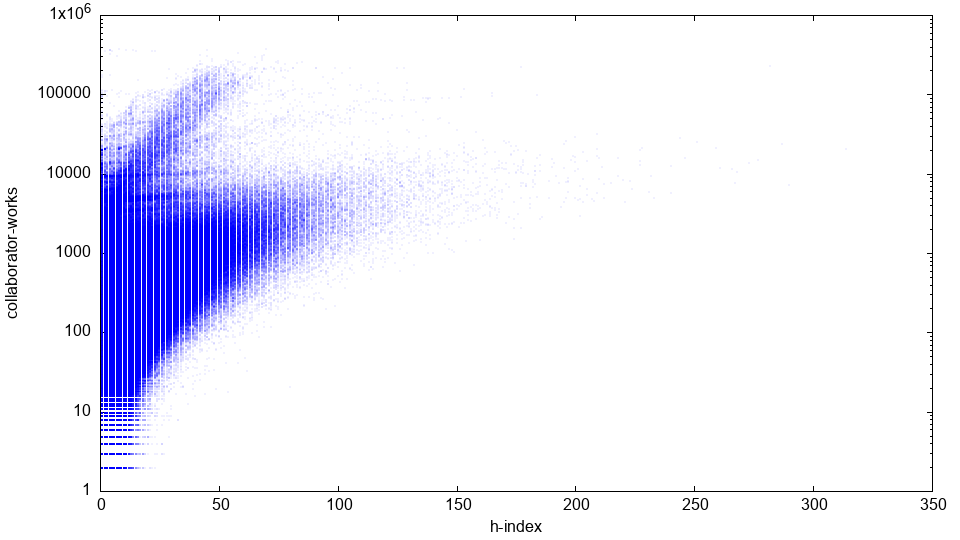
We repeat the same process as above, this time comparing the h-index with the collaborator-works score. The correlation coefficient in this case was 0.21, which is closer to 0 and thus indicates less correlation than the distinct collaborator score. It is likely that by including collaborators more than once (i.e. for each publication shared between them), this score is amplifying the impact of the uncontrolled factors mentioned above, resulting in lower correlation. The p-value was again extremely close to zero (0.000…(insert 119 zeros here)…000214), again indicating that the result is statistically significant and not a result of random chance. In graphical form, the data for these two variables look like this (logarithmic scale):
Collaborators and collaborator-works
While not the focus of this study, since the data for the two collaboration scores is available, it did not require extra effort to calculate the Pearson correlation coefficient between those two as well. The resulting coefficient was 0.6, significantly better than either of the h-index cases above. This makes sense, given that they are measuring very similar things.
General statistics
The general statistical values for the h-index, distinct collaborator score, and collaborator-works score were as follows:
| Variable | N | Mean | SD | VAR | Q1 | Median | Q3 | Min | Max |
|---|---|---|---|---|---|---|---|---|---|
| h-index | 13614439 | 3.93 | 7.04 | 49.60 | 1 | 1 | 4 | 1 | 314 |
| collaborator | 13614439 | 35.77 | 236.37 | 55872.04 | 3 | 7 | 17 | 1 | 23152 |
| collaborator-works | 13614439 | 129.31 | 1990.89 | 3963662.84 | 4 | 10 | 34 | 1 | 383994 |
Discussion
In the data filtering step of the analysis, I was able to remove records that were not journal entries, or that had been retracted, or that fell outside of the date range of interest, or that were not in English. In so doing, I was able to effectively control for variation caused by document type, retraction status, publication year, and language. However, there are still a large number of variables that aren’t accounted for, including discipline, institution, country, open access status, researcher gender, age, academic status, and more. The reduced value of the correlation coefficients between h-index and co-authorship diversity likely reflect the influence of these unaccounted variables.
Nevertheless, there is certainly some correlative interaction between them. There is a clear indication that having a high research impact as a researcher is connected with working with a diverse group of research collaborators. In contrast, we do not see an indication that researchers who tend to publish many works with only a small consistent group of collaborators have such a high impact (which would have been indicated through a negative value for the correlation coefficient).
Limitations
As an introductory study examining the correlation between an author’s h-index and their co-authorship diversity, this study has some significant limitations. The publication year, language, and document type limits of the study provide a narrow view of scholarly communication. The influence of uncontrolled variables has already been noted above, but it is also worth noting that the OpenAlex has its own shortcomings. Some authors may be represented by multiple author identifiers, while multiple authors may be assigned the same identifier, leading to difficulty disambiguating authors which is foundational to this analysis. Works may be attributed to the wrong authors. Some authors or works may not be included in the dataset at all. The language of the work may not have been accurately detected, a problem that is more prevalent in works with multilingual authorship and collaboration, or the publication year or document type may be incorrect. Despite the high quality of the OpenAlex dataset, it is not without its errors and limitations.
This study only considers works that have more than one author in its calculations. If an author has a single-author paper that has many citations and a co-authored paper that has few citations, only the latter will be considered when calculating the h-index and diversity scores. Conversely, the number of citations was collected without regard for the characteristics of the citing publication, meaning that self-citations could be included in that count, and articles published earlier in the window have more time to accumulate citations than those published later. This study also includes all co-authorship collaborations, including hyperauthorship papers, resulting in outliers that influence the statistical properties of the results.
Both the diversity scores and the h-index have limitations as well. The diversity scores defined above do not take into consideration the discipline the paper was published in, and disciplines often have significant differences in co-authorship and citation practices. They also do not account for diversity among the co-authors, for example giving higher value to collaborations that span institutions or disciplines. Discipline normalization is absent for the h-index as well. The h-index also suffers from being bounded by the total number of publications, which undervalues highly cited works and overvalues authors with higher academic age. The h-index as used here considers researchers only as individuals, rather than in the context of research groups or other formalized collaborations. As a proxy for research impact, the h-index fails to consider impacts outside of scholarly communication, including economic, technological, policy, health, environmental, cultural and other impacts.
Finally, correlation does not imply causation. This study cannot determine whether raising one’s h-index will cause their collaboration diversity to go up, nor whether having many different co-authors will cause one’s h-index to rise. Researchers may wish to collaborate more with those that have higher h-index, or may see their h-index rise as a result of the working with a diverse network of fellow researchers. However, it may be an unexamined factor such as social and economic privilege, which could result in more resources for the article publishing charges of more prestigious journals and opportunities to build relationships with collaborators.
Future Work and Conclusion
Future (or more likely past) work could examine these same questions with different filter criteria, for example other years and languages. One could also further differentiate this dataset by controlling more variables, for example comparing different fields or institutions, or examining how the data within this window changed over time. The OpenAlex dataset only contains a subset of all scholarly communication, and some of that subset contains errors, so it would be useful to conduct the same analysis using a different dataset and compare the results. An obvious and important area for comparison would be between these results and those for works with only a single author. Improvements to the indicators could also be explored, for example applying various weighting schemes to the collaboration scores, or using a research impact indicator more robust than the h-index. One could also explore collaborations outside of the academy (academic-private, academic-government, etc), and other non-scholarly impact avenues that might be captured by altmetrics.
Through this project, I have learned that working with full bibliometric datasets takes a lot of time and computing power. Simply downloading the original dataset required more than a day. It reinforced for me that indicators are not the same as the thing they purport to indicate. While working with large datasets can yield insights not available to smaller analyses, the comparison outcomes here may have been more meaningful if they had been applied to more controlled subsets of the data. Finally, given the number of potential variables that influence the analysis, it can be difficult to determine causation or derive meaningful support for change based on these results. The questions that bibliometrics are suited to address are varied and difficult, and creating meaning and impact through bibliometric analysis requires care and a great deal of work. I look forward to carrying these lessons forward in my research support career.